
Introducing the Flexport Consumption Forecast
What will the holiday season look like? That’s a regular question for anyone who’s involved in the production, transport, or retail business, given the importance of the fourth quarter to annual sales.
Flexport Research has been tracking and forecasting this extraordinary time through releases such as the Post-Covid Indicators. These indicators have tracked the remarkable swing in personal consumption away from services and toward goods. They also currently show durables consumption remaining strong relative to services, while nondurables consumption is moving quickly back to a pre-Covid ratio with services.
But what if you don’t want to worry about ratios? What if you want a forecast of what will happen next with the level of durables consumption? The level of nondurables? Or even subcategories like seasonal goods, or apparel? For that, we introduce the Flexport Consumption Forecast.
A forecast based on real-time data is better and more complete than one based solely on historical data. To that end, and to address the questions raised from an economics and logistics perspective, we’ve created the Flexport Consumption Forecast. This corresponds to the U.S. Bureau of Economic Analysis’s Personal Consumption Expenditure figures.
In short, the Flexport Consumption Forecast (FCF) shows the outlook for real (i.e. inflation-adjusted) Personal Consumption Expenditures on a seasonally adjusted basis.
Users’ Guide
What is the Flexport Consumption Forecast and how should it be used?
As seasonally-adjusted real numbers, these forecasts provide a guide to whether we will see a boom or a bust. The detailed forecasts indicate whether different sectors are moving in parallel or diverging. Because they are seasonally adjusted, this is not a good guide to the raw volume of goods being purchased. It’s normal for more goods to be purchased in Q4, and it’s already baked in.
What products does it cover?
This covers everything in the Personal Consumption Expenditure report. At a broad level, that means services, durable goods (those that are meant to last three years or more), and nondurable goods. But we go further than that. For the goods categories we look at a number of subcategories, providing a new level of detail not generally seen in consumption forecasts.
Now will you rest on your laurels?
Nope. We plan to turn this out monthly. Unlike this initial holiday preview, it will generally come out in the middle of the month and cover the next four months beyond what the government has reported. If that sounds a little convoluted, it’s because we will only see October numbers at the end of November, so an updated forecast of October would still have value, even in the middle of next month.
Methodology
There are two main ways economists predict future numbers. One is to solve a big structural model of the economy. The other is to look carefully at how numbers follow trends and project those trends out in sophisticated ways. The Flexport Consumption Forecast follows the latter approach but enhances this “time series” method with insights gleaned from Flexport data. There is generally a relationship between what ships in September and what people consume in November. Our methodology takes advantage of that correlation to produce a more accurate forecast. These are forecasts and there will be misses. But those misses are likely to be smaller than they would be without Flexport data.
Consumption Forecast: End of Year Strength
Flexport’s Consumption Forecast (FCF) shows the outlook for real (inflation-adjusted) Personal Consumption Expenditures on a seasonally-adjusted basis. The December FCF projects real consumption to increase 2.3% from October to February, the end of the forecast period.
Most of the growth will be in Durables, which are predicted to end 3.6% higher while Nondurables will only increase 1.6% over the four-month forecast period.
The Methodology: The Flexport Consumption Forecast that follows augments time series analysis with insights gleaned from Flexport data. There is generally a relationship between what ships in September and what people consume in November, for example. Our methodology takes advantage of that correlation to produce a more accurate forecast.
Update December 18, 2023: The elevated pressure on global supply chains has been the result of several factors in combination: strong incomes, a willingness to spend rather than save, and a heightened preference for goods in consumption. Flexport’s Consumption Forecast tracks personal consumption expenditures by category on a seasonally adjusted basis.
Note: Our forecast reflects the current Bureau of Economic Analysis estimates for PCE. They are often subject to revision.
Fig. 1 Spending Strong in to the 1st Quarter of Next Year
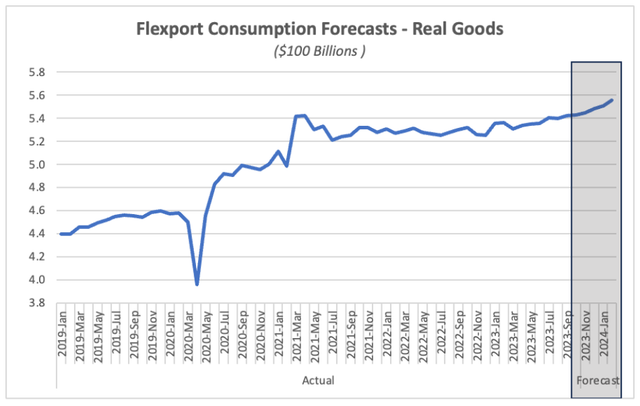
Fig. 1 shows the path of real U.S. Personal Consumption Expenditures (PCE) from a year before the onset of the pandemic through to the end of the current forecast period in February 2024. Up to the end of 2021, there was a striking level of volatility in overall consumption behavior, which settled a bit as 2022 approached. Throughout 2022, 2023, growth in PCE was notably steadier. We see things picking up. Over the forecast period we predict the growth in real goods consumption to be approximately 2.3%. That’s a significant acceleration, as it is 7.1% on an annualized basis.
Among the subcomponents of PCE, the strongest growth will come from durable goods, forecast to rise (in real terms) by 3.6% in the 4-month forecasting period (over 10.0% at an annual rate!). Nondurable real spending is predicted to grow at 1.5% (4.5% annualized).
Fig. 2 Nondurables are Expected to Grow at a Moderate Pace
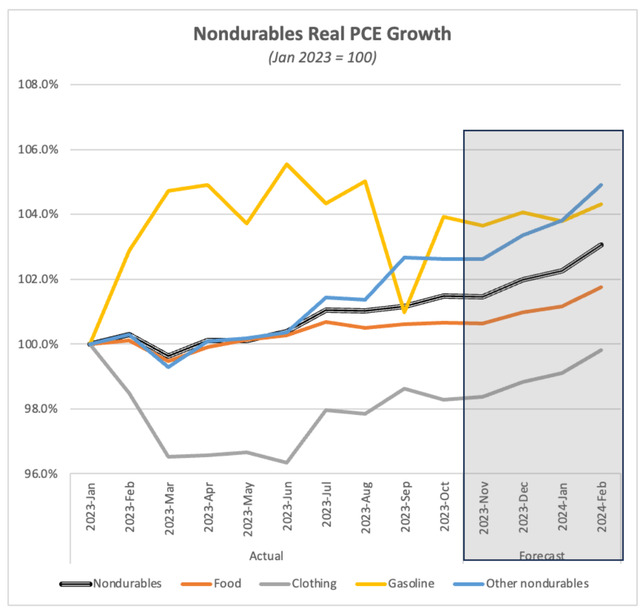
For those goods that are supposed to last less than three years - nondurables - all categories are expected to increase over the forecasting period.
The highest growth category is expected to be Other Nondurables which is predicted to grow by 2.2% over the forecast period. Gasoline is predicted to be the slowest growing category up only 0.4% over the forecasting period and the other categories are between 1% and 2%.
Fig. 3 Durable Goods Continue to Show Strength
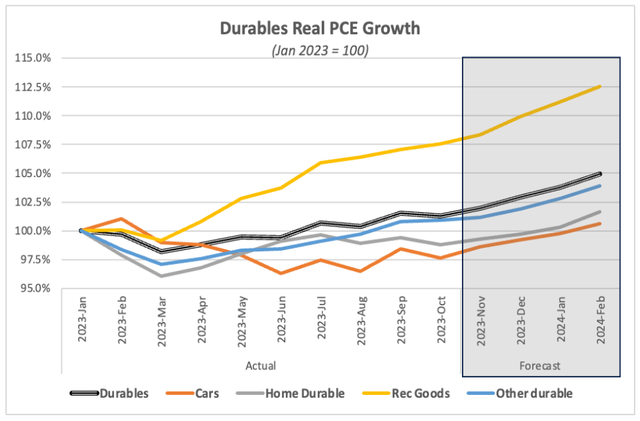
The surprising strength in durables remains broad based; all subcategories of durables spending are predicted to have significant growth as we finish 2023 and start the new year. The highest growth is forecast in “Recreational Goods” – over 4.5%. The other categories are expected to have strong growth hovering around 2.0% during the forecast period. The entire category is expected to increase by over 3.5%.
Please direct questions about the Flexport PCI to economics@flexport.com.
Disclaimer: The contents of this report are made available for informational purposes only and should not be relied upon for any legal, business, or financial decisions. Flexport does not guarantee, represent, or warrant any of the contents of this report because they are based on our current beliefs, expectations, and assumptions, about which there can be no assurance due to various anticipated and unanticipated events that may occur. This report has been prepared to the best of our knowledge and research; however, the information presented herein may not reflect the most current regulatory or industry developments. Neither Flexport nor its advisors or affiliates shall be liable for any losses that arise in any way due to the reliance on the contents contained in this report.